The Compounding Baseline · No. 1 — Fiscal Arithmetic
What fifty years of the last decade’s rates would do to an ordinary American budget — measured entirely in federal data.
Reading time: 4 minutes · All figures from U.S. Treasury, BLS, DOL, and CBO sources.
Download this piece as a PDF — PDF · 4 pp · 304 KB
The prevailing view treats today’s pressures — housing costs, grocery inflation, a strained federal budget — as cyclical friction that policy will normalize. This piece makes no claim about whether that is right. It asks a narrower question: what if nothing changes? Take six federal data series, measure how fast each moved over the last completed decade, and extend each at its own observed rate for fifty years. No policy response. No mean reversion. Just arithmetic, run to the end.
1. The Baseline
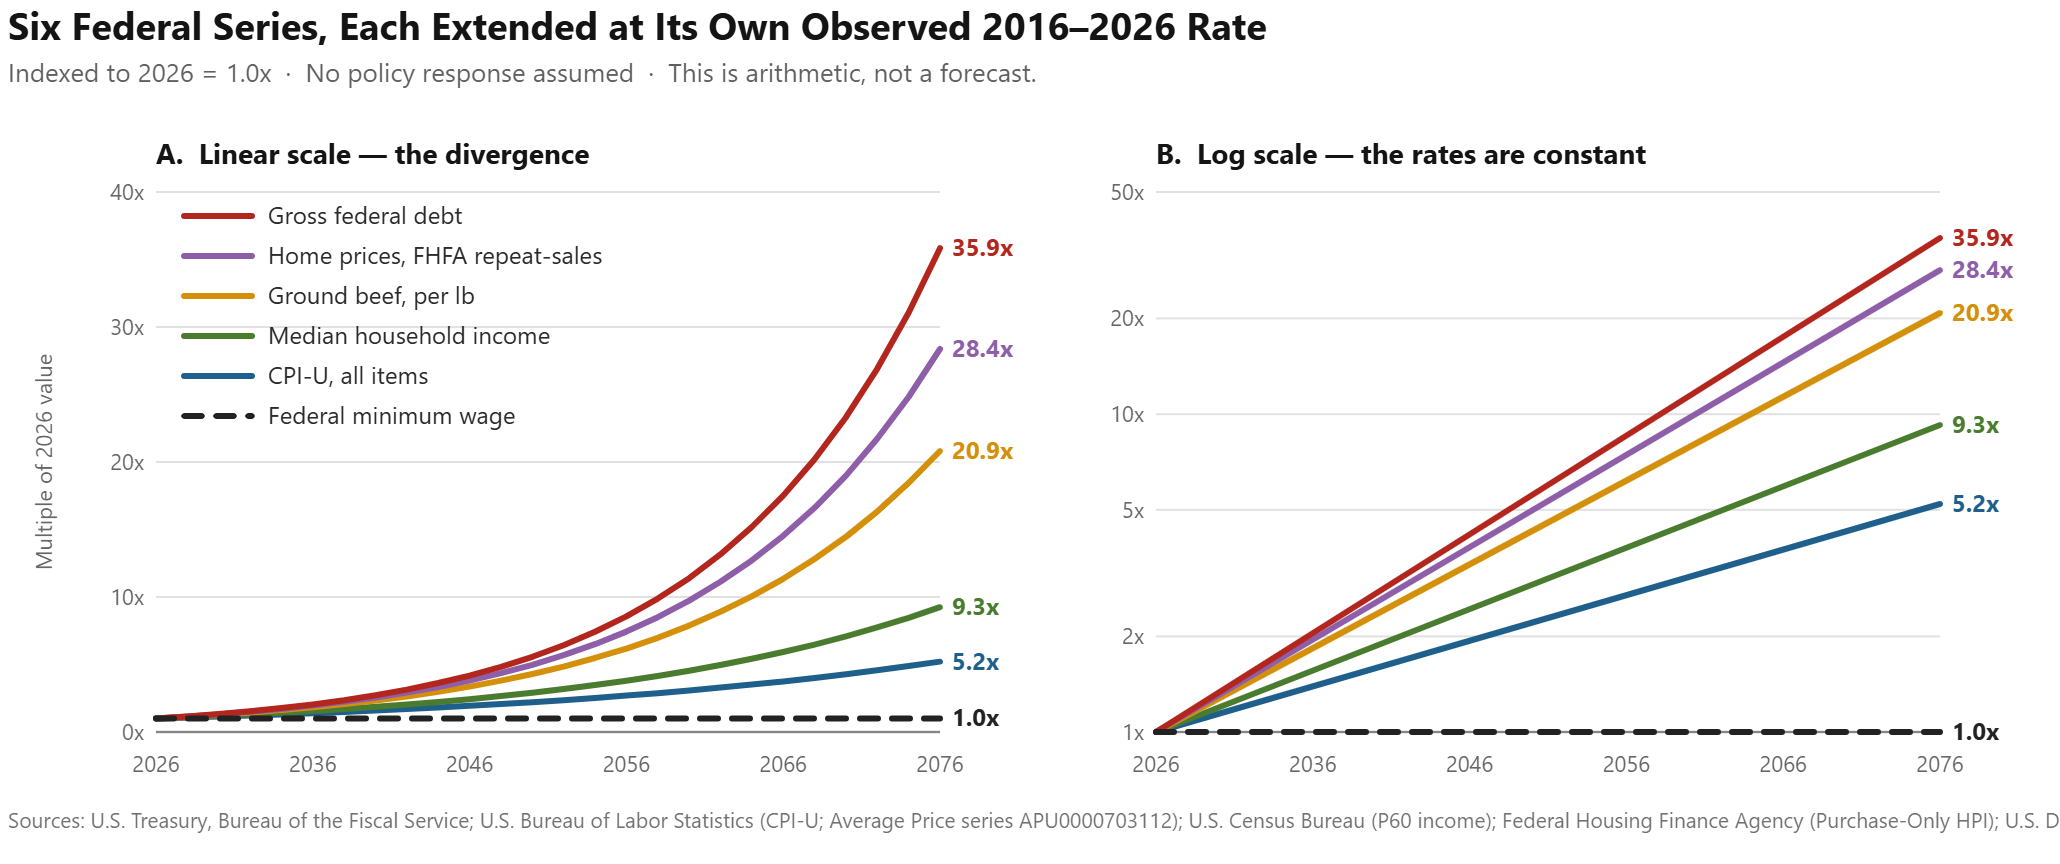
Between August 2016 and August 2026, gross federal debt rose from $19.57 trillion to $40.05 trillion — a 104.65% increase, or a decade multiplier of 2.0465x. Held constant, fifty years contains five of those doublings: a 35.90x multiplier, carrying the balance sheet to roughly $1,437.7 trillion by 2076.
That figure is arithmetically correct and analytically useless. No reader can form an intuition about a quadrillion dollars, and the number is unfalsifiable within a lifetime. Its only honest function is as a signal that at least one input must break. The rest of this piece asks which one — by projecting the same logic onto items people actually buy.
| Series | 2016 | 2026 | Per decade | Per year | 50-yr | 2076 |
|---|---|---|---|---|---|---|
| Gross federal debt | $19.57T | $40.05T | 2.0465x | 7.42% | 35.90x | $1,437.7T |
| Ground beef, per lb | $3.75 | $6.89 | 1.8360x | 6.26% | 20.86x | $143.64 |
| Median household income | $53,657 | $91,523 | 1.5605x | 4.55% | 9.25x | $846,848 |
| CPI-U, all items | 240.0 | 333.9 | 1.3913x | 3.36% | 5.21x | — |
| Home prices (FHFA HPI) | 223.11 | 435.69 | 1.9528x | 6.92% | 28.40x | — |
| Federal minimum wage | $7.25 | $7.25 | 1.0000x | 0.00% | 1.00x | $7.25 |
2. Three Impact Zones
Each zone shows today’s measured baseline against the same series extended fifty years at its own observed rate. Left column is fact. Right column is arithmetic.
2.1 Squeezed credit & mortgages
Today’s baseline — 2026
The median U.S. home: $403,200
- Median household income: $91,523
- Years of income per home: 4.4
- Minimum-wage hours per home: 55,614
The payment — 20% down, 30-yr fixed at 7%
- Loan: $322,560 · $2,146/month
- 296 minimum-wage hours per month — 41% of every hour that exists in a month
Result: a stretch, but reachable on a median income.
The 50-year extension — 2076
Home prices at 6.92%/yr → $11,450,206
- Median income at 4.55%/yr → $846,707
- Years of income per home: 13.5
- Minimum-wage hours per home: 1,579,339
The payment — loan $9,160,165
- At 7%: $60,943/mo — 86.4% of income
- At 12%: $94,223/mo — 133.5% of income
- At 20%: $153,068/mo — 216.9% of income
- At 7%, that is 8,406 minimum-wage hours per month — 11.5 times every hour in a month
Result: in real terms the payment rises 5.4x while real income rises 1.8x. Ownership stops being expensive and becomes arithmetically unreachable by wage labor.
House prices: Federal Housing Finance Agency, Purchase-Only House Price Index (Q2 2016 = 223.11; Q2 2026 = 435.69), a repeat-sales index tracking the same properties over time. Dollar anchor: Census/HUD median sales price. Income: Census P60. Payments are principal and interest only.
2.2 Crowding out of services
Today’s baseline — 2026
The federal budget
- Gross debt: $40.05 trillion
- Net interest: ~$1.0 trillion
- Federal revenue: ~$5.4 trillion
- Interest = 18.5% of all revenue in FY2025 — the highest share since the series began in 1940
Result: interest now rivals total national defense outlays.
The 50-year extension — 2076
Debt at 7.42%/yr → $1,437.7 trillion
Revenue at 4.88%/yr → $58.6 trillion. Outcome depends entirely on the average rate Treasury pays:
- At 2.6%: $37.4T = 64% of revenue
- At 3.4%: $48.9T = 83% of revenue
- At 5.0%: $71.9T = 123% of revenue
Result: a 240 bp range in one variable decides whether this is manageable or arithmetically impossible.
Debt: U.S. Treasury. Revenue and net interest: Congressional Budget Office, FY2025. Rate scenarios reflect rollover of low-coupon 2010s issuance into current market yields.
2.3 Wage vs. food divergence
Today’s baseline — 2026
The hourly purchasing-power split
- Federal minimum wage: $7.25/hr (unchanged since July 2009 — 0% per decade)
- Ground beef: $6.89/lb (BLS APU0000703112)
- Labor per pound: 57 minutes
Result: 2.99M workers were at or below the federal floor in 2014; 843,000 in 2024.
The 50-year extension — 2076
Zero versus 6.26% per year
- Projected minimum wage: $7.25/hr (0% rate extended — real value falls to $1.39)
- Projected ground beef: $143.64/lb (20.86x)
- Labor per pound: 19.8 hours
Result: the floor is never repealed. It dissolves. This is the one zone where the draft’s original conclusion survives the data intact.
Most U.S. hourly workers are covered by higher state or local minimums. This measures the failure of federal indexation, not typical earnings. Real value deflated by CPI-U (5.21x over 50 years).
3. The Question
Note what the arithmetic does not say. It does not say the dollar collapses, or that any date is a prediction. It says something narrower and harder to dismiss: six federal series that must eventually be reconciled with one another are moving apart at rates that have held for a full decade, and nothing in the data itself contains a mechanism for closing the gap.
Note also what the dollar itself is doing. Deflated by CPI-U, one dollar in 2076 buys what 19 cents buys today. Real median household income roughly doubles over the period. Real home prices rise more than fivefold, and a pound of ground beef rises fourfold. Wages are not falling. They are simply indexed more slowly than everything a household has to buy.
4. Method and Limits
Method. Each series is extended at its own compound rate over its most recent complete ten-year window. No policy response, no cyclical adjustment. This is a stress test of the no-intervention case, not an expected outcome.
Debt growth is treated as exogenous. It is not — higher interest costs widen deficits, which accelerate debt growth. The model is therefore conservative in the out-years.
The 2016–2026 window contains one pandemic. Roughly a quarter of the decade’s debt growth traces to 2020–21 emergency spending. Whether that recurs decadally is what the model assumes and cannot demonstrate.
Housing is measured two different ways and they disagree sharply. The FHFA Purchase-Only index tracks repeat sales of the same properties and gives 6.92%/yr. The Census/HUD median sales price of new houses gives 2.83%/yr, because builders shifted toward smaller, cheaper units over the decade. The repeat-sales index is the correct measure of what happens to a given house; the median new-home price measures a changing product. That distinction reverses the conclusion of this section entirely, and is disclosed here for that reason.
Ground beef is one item, not a basket. Its 6.26% rate reflects the cattle cycle alongside general inflation. BLS advises using CPI category indexes rather than average-price series to measure change over time; the dollar price is used here because it is legible, and the CPI-U line is shown alongside it as the control.
Every figure past 2026 is model output — not a forecast, estimate, or prediction. It is arithmetic executed on stated assumptions, and it is worth exactly what those assumptions are worth.
Sources
- Congressional Budget Office. Monthly Budget Review: Summary for Fiscal Year 2025. Washington, DC: Congressional Budget Office, November 2025.
- U.S. Bureau of Labor Statistics. Average Price Data: Ground Beef, 100% Beef, per lb., U.S. City Average. Series APU0000703112. Washington, DC: U.S. Department of Labor.
- U.S. Census Bureau. Income in the United States: 2024. Current Population Reports P60-286. Washington, DC: U.S. Government Publishing Office, September 2025.
- U.S. Federal Housing Finance Agency. Purchase-Only House Price Index for the United States. Series PONHPIM226S, 1991:Q1 = 100, seasonally adjusted. Washington, DC: FHFA.
- U.S. Census Bureau and U.S. Department of Housing and Urban Development. Median Sales Price of Houses Sold for the United States. Series MSPUS. New Residential Sales.
- U.S. Bureau of Labor Statistics. Characteristics of Minimum Wage Workers. Annual reports, 2014 and 2024. Washington, DC: U.S. Department of Labor.
- U.S. Bureau of Labor Statistics. “Consumer Price Index — July 2026.” News release USDL-26-1378. Washington, DC: U.S. Department of Labor, August 12, 2026.
- U.S. Department of Labor, Wage and Hour Division. History of Federal Minimum Wage Rates Under the Fair Labor Standards Act, 1938–2009. Washington, DC: U.S. Department of Labor.
- U.S. Department of the Treasury, Bureau of the Fiscal Service. Average Interest Rates on U.S. Treasury Securities. Fiscal Data.
- U.S. Department of the Treasury, Bureau of the Fiscal Service. Debt to the Penny. Fiscal Data. Accessed August 25, 2026.
Analytical exercise prepared for discussion. Not investment, tax, or legal advice, and not a recommendation to buy, sell, or hold any security. Projections are hypothetical extensions of historical rates and are not indicative of any future result. Readers should verify all figures against the primary sources cited above.


Leave a Reply